> ## Documentation Index
> Fetch the complete documentation index at: https://gcore-doc-1046.mintlify.site/llms.txt
> Use this file to discover all available pages before exploring further.
# Monitor load on a specific node
You can monitor load and performance of your nodes through four metrics.
## Navigate to monitoring
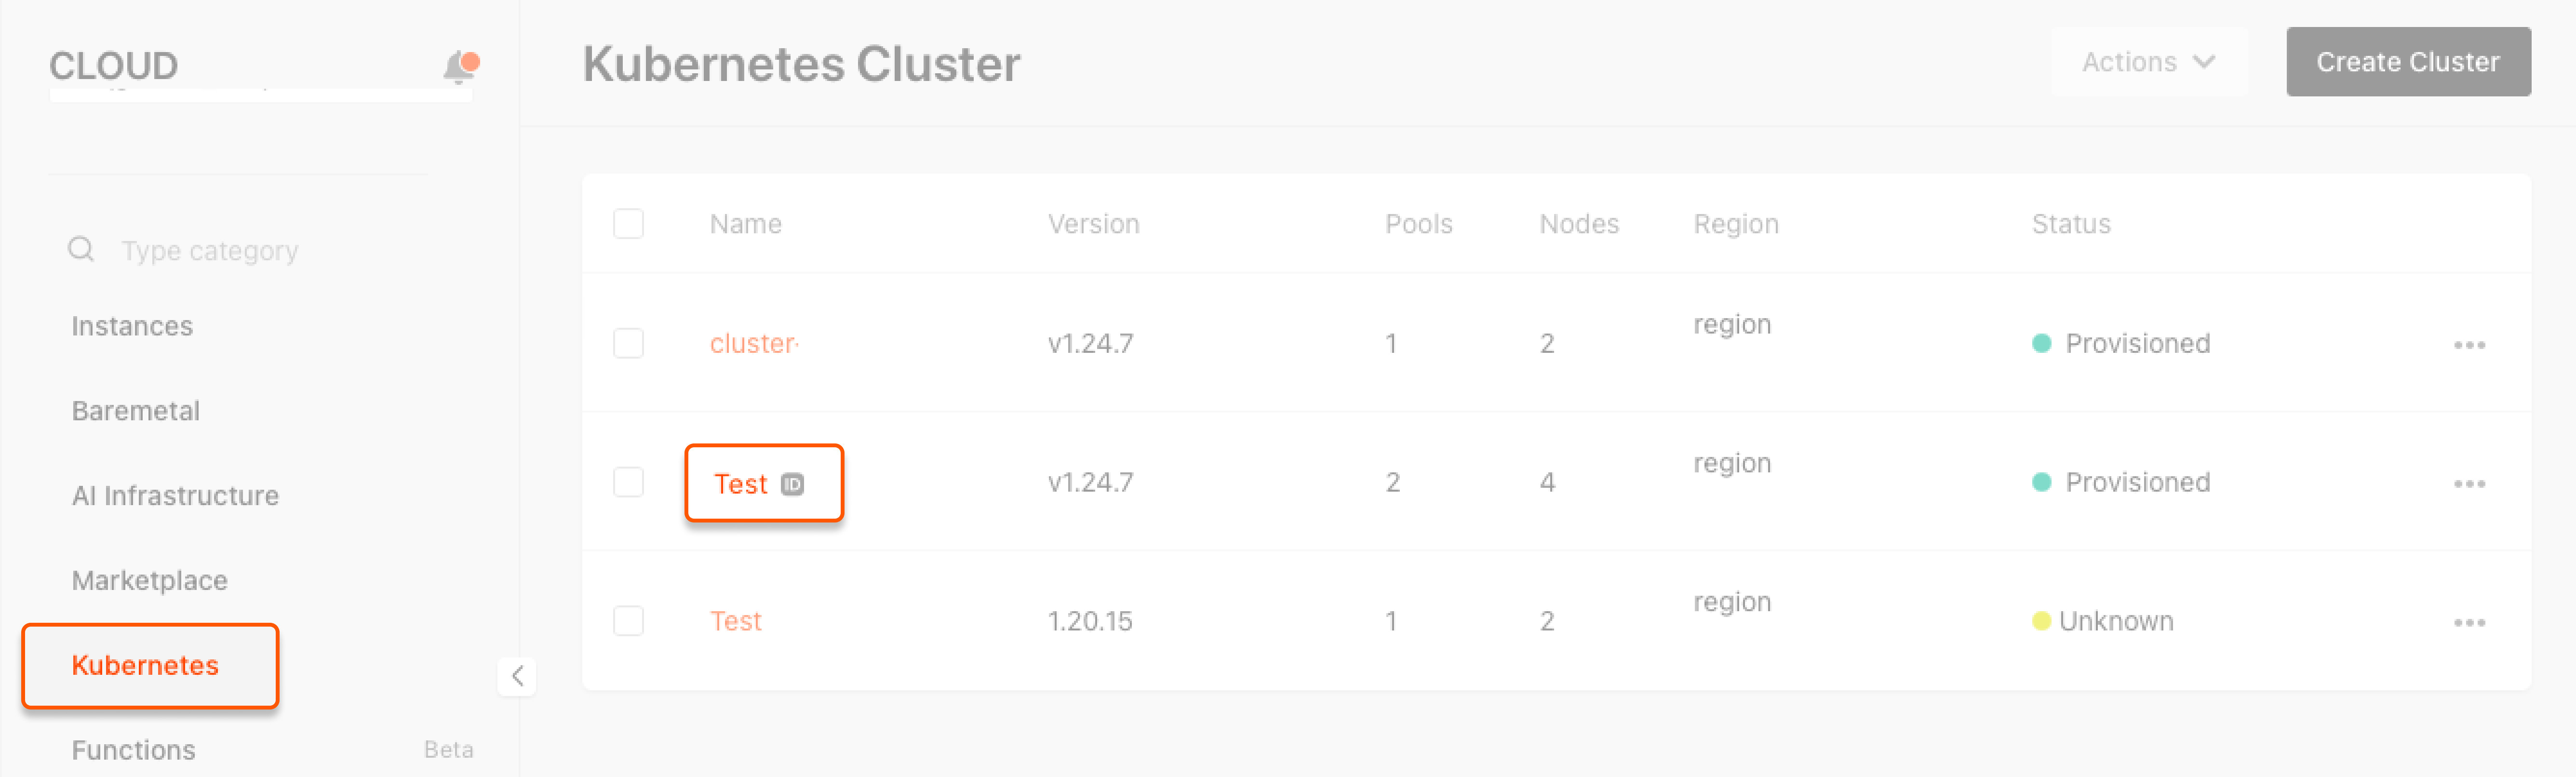
1\. In the Cloud menu, go to **Kubernetes**, find the required cluster and click its name.
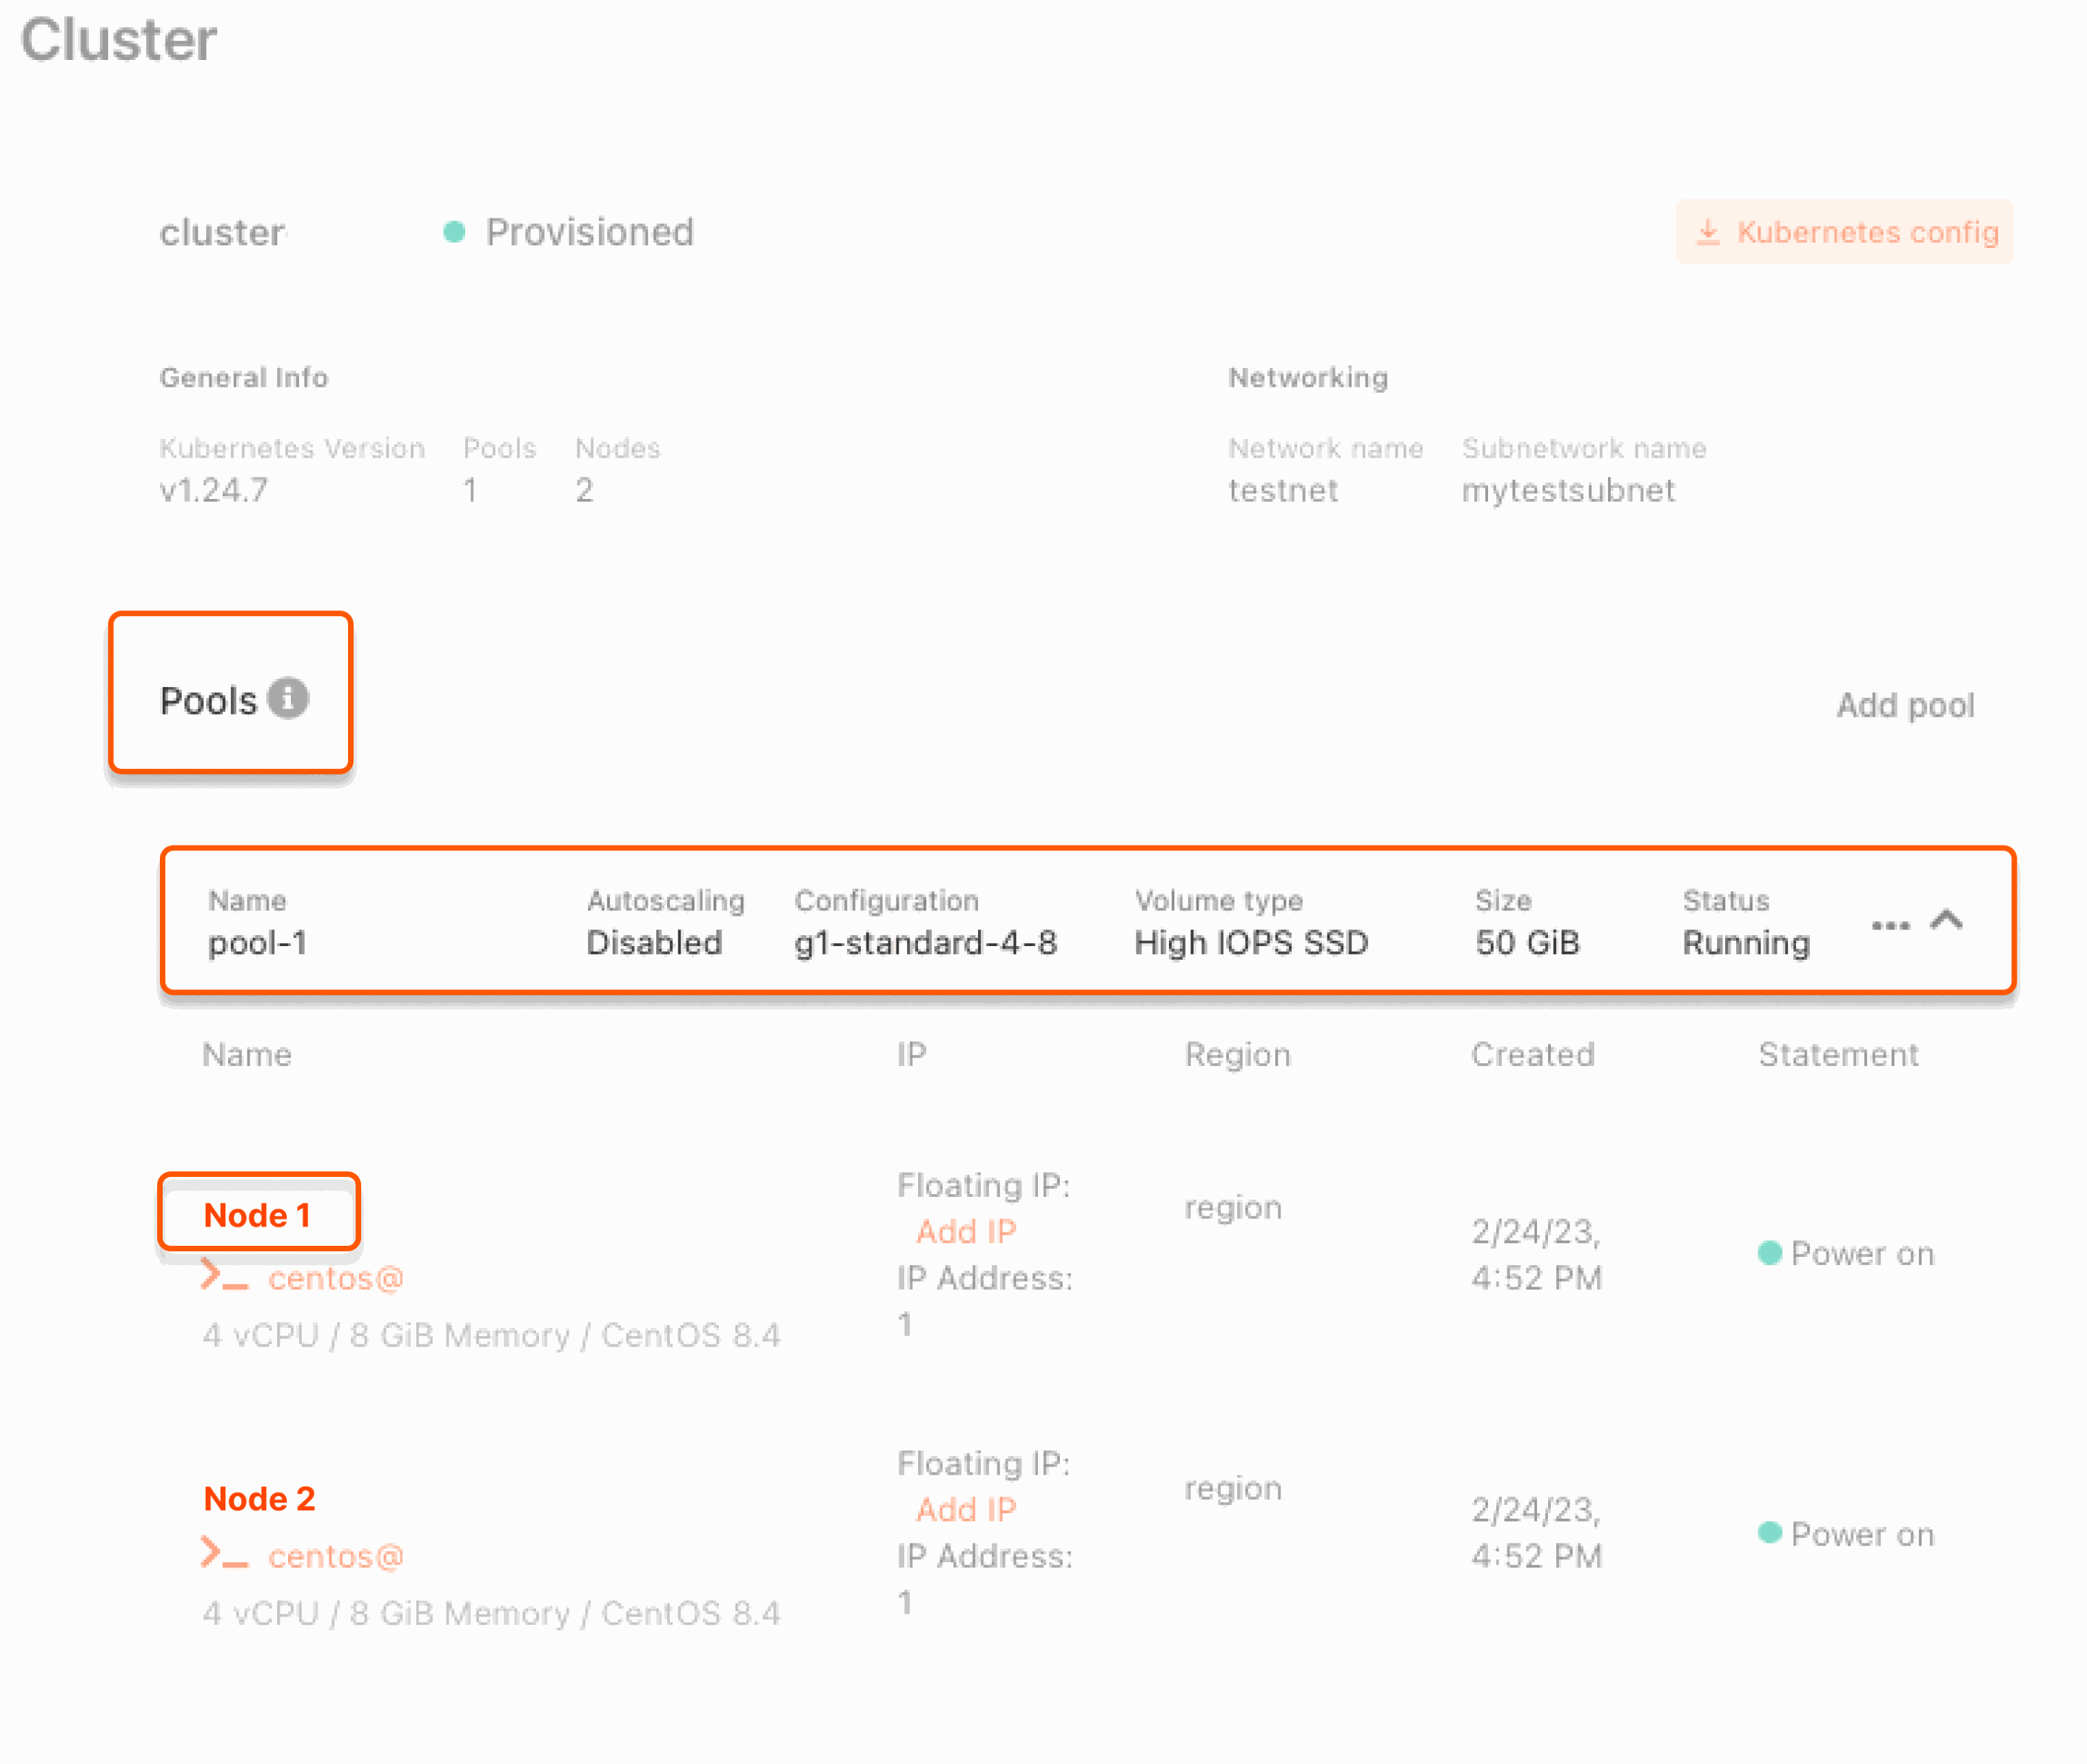
 2\. Go to the **Pools** section, click the required pool to expand the menu, and the click the required node.
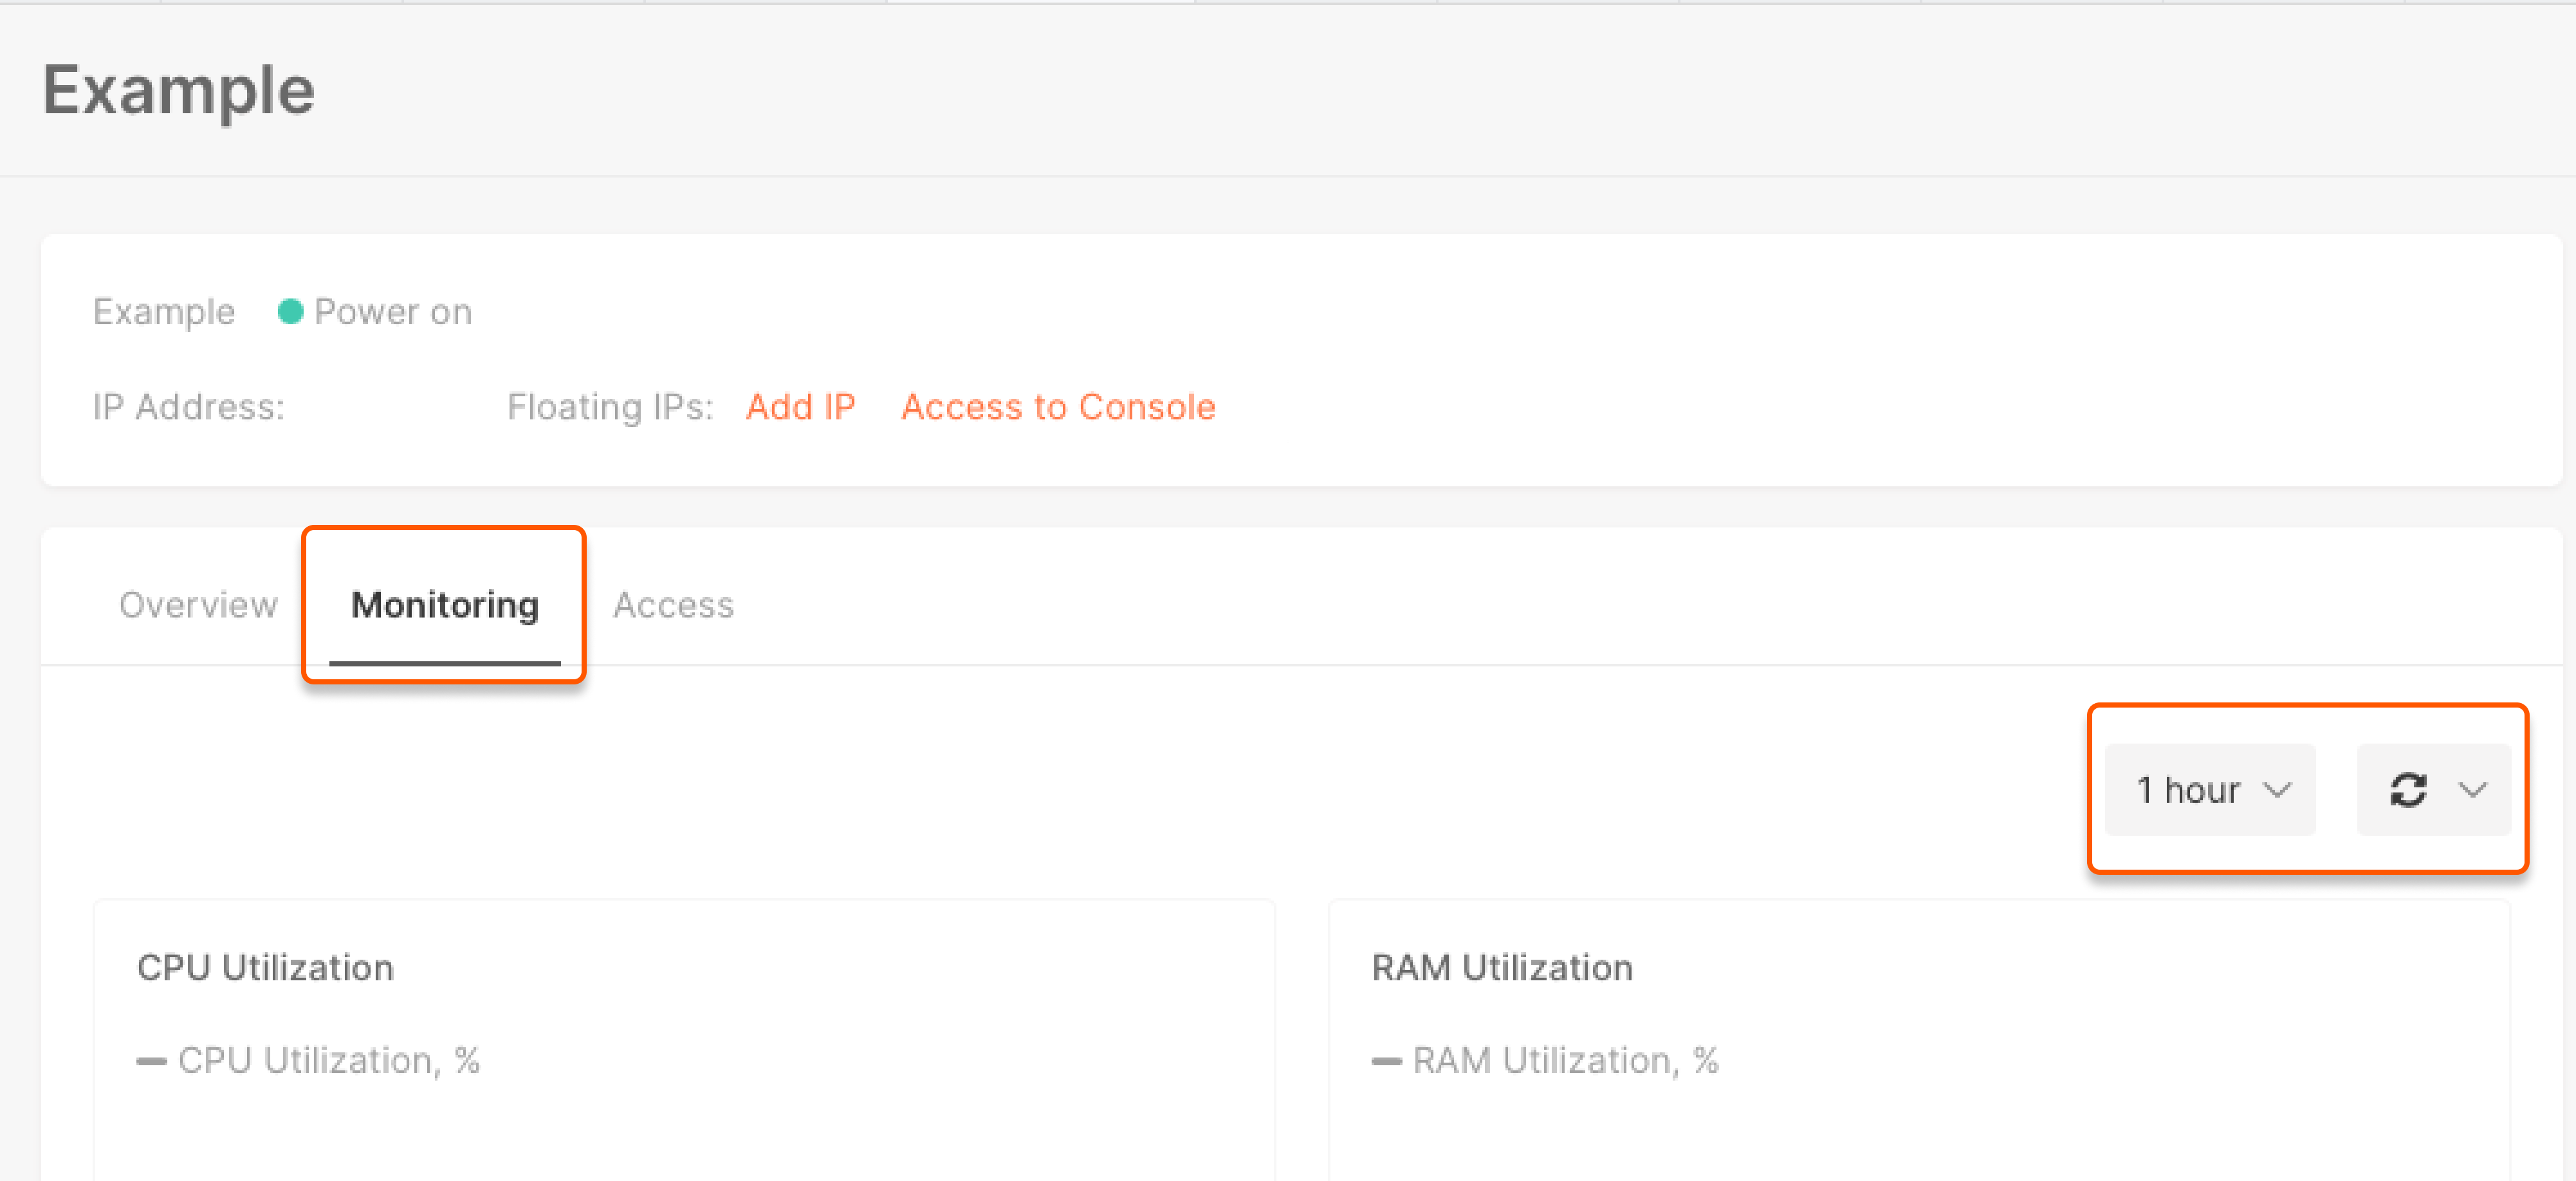
 3\. In the new window, switch to the **Monitoring** tab.\
The buttons to the right above the graphs regulate the presentation of statistics. The left button sets the period to be shown, and the right button sets the frequency at which data will be updated on the screen.
3\. In the new window, switch to the **Monitoring** tab.\
The buttons to the right above the graphs regulate the presentation of statistics. The left button sets the period to be shown, and the right button sets the frequency at which data will be updated on the screen.
 **Note** : the Monitoring feature shows the average value per minute for metrics that are measured in seconds (e.g., the number of bytes per second). The system calculates the volume of traffic/operations per minute and then divides it by 60.
## Metrics
You can monitor the state of a Virtual Machine using 4 metrics:
1\. The **CPU Utilization** metric measures the load on the machine's CPU as a percentage. For example, if all cores are at 90% usage, the value displayed will be 90%.
2\. The **RAM Utilization** refers to the amount of RAM being utilized by the VM to perform tasks. It is measured as a percentage, with 100% indicating full utilization of RAM. The RAM Utilization value inside the system might appear to be lower than what is shown in Monitoring, which is normal. Monitoring takes into account cache RAM as a part of its statistics. Cache RAM is unused RAM that the machine borrows and uses to improve application performance. If an application needs more RAM, the system immediately retrieves it from cache. 3. The **Network Traffic** is the speed of traffic, measured in Mbit per second. 4. The **Network Packets** is the speed of traffic, measured in packet per second.
**Note** : the Monitoring feature shows the average value per minute for metrics that are measured in seconds (e.g., the number of bytes per second). The system calculates the volume of traffic/operations per minute and then divides it by 60.
## Metrics
You can monitor the state of a Virtual Machine using 4 metrics:
1\. The **CPU Utilization** metric measures the load on the machine's CPU as a percentage. For example, if all cores are at 90% usage, the value displayed will be 90%.
2\. The **RAM Utilization** refers to the amount of RAM being utilized by the VM to perform tasks. It is measured as a percentage, with 100% indicating full utilization of RAM. The RAM Utilization value inside the system might appear to be lower than what is shown in Monitoring, which is normal. Monitoring takes into account cache RAM as a part of its statistics. Cache RAM is unused RAM that the machine borrows and uses to improve application performance. If an application needs more RAM, the system immediately retrieves it from cache. 3. The **Network Traffic** is the speed of traffic, measured in Mbit per second. 4. The **Network Packets** is the speed of traffic, measured in packet per second.